🔍 Understanding LPS
A technical overview of how LPS models traffic, controls execution, and exposes runtime metrics.
LPS uses a small set of execution primitives that compose cleanly.
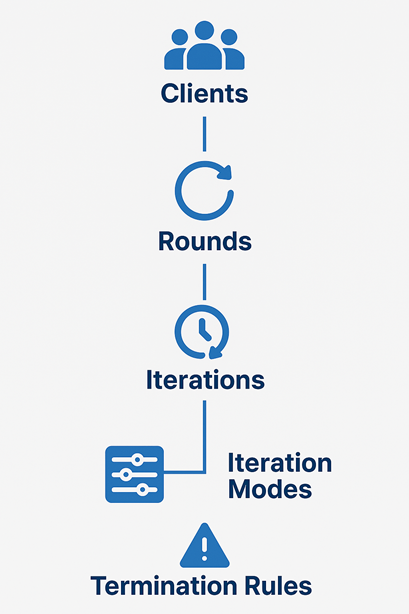
The core model is:
Clients + Rounds + Iterations + Iteration Modes + Termination Rules
This is only one part of the tool. LPS also includes execution, observability, and analysis features that matter once the test starts running.
The LPS mental model
- Choose your clients to represent the virtual users entering the system.
- Split the test into rounds so each phase can represent a different traffic stage.
- Add iterations to define the actual work performed in each round.
- Select an iteration mode to decide whether the work runs by count, duration, or burst behavior.
- Apply termination rules when you want the run to react to live conditions instead of only a timer.
Meet the building blocks
👥 Clients
Clients are your virtual users. They control how many independent actors enter the test and when they join. That makes it easy to model gradual user arrival instead of dropping all traffic at once.
🔁 Rounds
Rounds are the major phases of the run. Use them to represent warm-up, ramp-up, steady-state pressure, or a final spike. Each round can have its own load profile and its own set of iterations.
🔄 Iterations
Iterations define what actually happens: which endpoint is targeted and what request behavior should run. They are the unit that turns a round from an idea into traffic.
- Run a fixed number of requests
- Run for a fixed duration
- Send requests in bursts
- Combine multiple iterations in parallel or as a flow
🧠 Iteration Modes
Iteration modes define the traffic shape for each iteration. This is where LPS becomes expressive without becoming complicated.
D— run for a specified durationR— run for a fixed number of requestsDCB— burst, cool down, and repeatCB— continuous bursts until you stop the run or a rule ends it- Additional modes let you match different traffic patterns without custom scripting
⏹️ Termination Rules
Termination rules make your tests aware of system behavior. Instead of waiting for a timer to finish, you can stop when the application crosses a threshold that matters.
- Example: stop the test if the error rate reaches 5% for 3 consecutive seconds
- Define which HTTP status codes count as errors for your environment
This capability is what turns a fixed run into a smarter feedback loop.
Representative examples
Start with a common baseline example, then move to more specialized traffic patterns. That makes it easier to see what is standard load-testing behavior and what LPS adds beyond the basics.
| Example | Why it matters | How common it is | What this example shows in LPS |
|---|---|---|---|
| Steady ramp-up with SLA checks | Common baseline for API and service validation before release | Very common | How to ramp users in gradually and enforce latency or error thresholds during the run |
| Burst, cooldown, repeat, stop early on failure | Useful for polling, retries, webhook spikes, queue drain traffic, and batch-style request patterns | Common in backend and event-driven systems | How traffic shape, arrival timing, and real-time termination rules can be expressed in one configuration |
| Distributed run with live dashboard and persisted metrics | Needed when one machine is not enough or when runs must be retained and compared over time | Less common day-to-day, important for larger environments | How distributed execution, live visibility, and persistent metrics work together during larger test runs |
Detailed example 1: steady ramp-up with SLA checks
This is the more common case. Many teams start by validating that a service can ramp up to a target level and stay within expected latency and error thresholds.
| Requirement | Typical tools | LPS |
|---|---|---|
| Ramp users in gradually | Usually expressed with thread groups, stages, or arrival-rate settings | numberOfClients with arrivalDelay |
| Run for a fixed test window | Usually configured as a duration or scheduler window | mode: D with duration; each client runs for that duration from its own start time |
| Fail the run if SLA targets are missed | Often split across assertions, thresholds, or post-run checks | failureRules and terminationRules |
The same baseline scenario in LPS
name: PaginatedBaselineWithSLA
rounds:
- name: BaselineRound
  numberOfClients: 50
  arrivalDelay: 200
  iterations:
  - name: PaginatedListCheck
    mode: D
    duration: 300
    httpRequest:
      url: https://api.example.com/data?page=$counter(start=1, reset=10)
      httpMethod: GET
    failureRules:
      - metric: "TotalTime.P95 > 500"
      - metric: "ErrorRate > 0.01"
        errorStatusCodes: ">= 500"
    terminationRules:
      - metric: "ErrorRate > 0.05"
        gracePeriod: "00:00:10"
errorStatusCodes: ">= 500"duration: 300 applies per client execution of the iteration. With numberOfClients: 50 and arrivalDelay: 200, clients are staggered by 200 ms, so the last client starts about 9.8 seconds after the first one and can continue running for its own 300-second window unless a termination rule stops it earlier. During that window, each client keeps requesting paginated data using $counter(start=1, reset=10), which simulates users repeatedly navigating through list pages.
Why this baseline example comes first
- It matches a very common workflow for release validation and capacity checks
- It introduces the core controls first: clients, arrival timing, duration, and rules
- It makes the execution model explicit: duration is applied per client, while arrival delay controls when each client enters the round
- It sets context before moving to more specialized traffic shapes
Detailed example 2: app gateway burst waves
After the baseline case, this example shows where LPS becomes more distinctive. Here, each client represents a load-generating infrastructure node such as an app gateway, proxy, or edge worker.
Example scenario:
- 🚀 Each gateway node forwards a large burst of requests
- ⏱ Pause for 5 seconds
- 🔁 Repeat that forwarding cycle
- 🕒 Keep it running for 5 minutes
- 🛑 Stop early if the system starts failing
In this framing, a client is not a single end user. It is a forwarding node releasing aggregated traffic toward the target service.
| Requirement | Typical tools | LPS |
|---|---|---|
| Send traffic in bursts | Usually needs samplers plus loop structure or custom orchestration | mode: DCB with batchSize |
| Pause 5 seconds between bursts | Usually handled by a separate timer or delay component | coolDownTime: 5000 |
| Keep repeating for 5 minutes | Often expressed through loops plus duration control | duration: 300 |
| Stop early when the system degrades | Often wired through extra checks, thresholds, or custom stop conditions | terminationRules with metric, gracePeriod, and optional errorStatusCodes |
The same gateway-wave scenario in LPS
name: AppGatewayBurstWaves
rounds:
- name: EdgeTierRound
  numberOfClients: 10
  arrivalDelay: 500
  iterations:
  - name: ForwardedRequestWave
    mode: DCB
    duration: 300
    batchSize: 100
    coolDownTime: 5000
    httpRequest:
      url: https://api.example.com/checkout/submit
      httpMethod: POST
      headers:
        content-type: application/json
      payload:
        type: Raw
        raw: |
          {
            "productId": "promo-drop-01",
            "quantity": 1,
            "channel": "app-gateway",
            "region": "edge-cluster-a"
          }
    terminationRules:
      - metric: "ErrorRate > 0.05"
        gracePeriod: "00:00:03"
        errorStatusCodes: ">= 500"
Why this example is worth showing
- It combines multiple LPS primitives instead of isolating only one feature
- It maps cleanly to infrastructure behavior such as app gateways, proxy tiers, edge nodes, and other forwarding layers
- It shows the execution model clearly: each client is a traffic source node, while
batchSizerepresents the size of each forwarded wave
Execution and observability features
Iteration modes are only one part of the system. The rest of LPS is about how tests execute, how rules are enforced, and how metrics are exposed while the run is in progress.
🌐 Distributed execution
LPS supports distributed load testing with a master/worker gRPC model. The master aggregates metrics, maintains global state, and hosts the dashboard. Workers run the same test command locally and wait until the master is ready or already running.
- The master can also execute load if configured as a worker
- Aggregated metrics are evaluated centrally on the master
- The built-in dashboard reflects combined worker output
📏 Rules and SLA enforcement
LPS separates failure rules from termination rules. Failure rules classify the final result after an iteration completes. Termination rules are evaluated continuously during execution and require a violation to persist for the full grace period before the iteration is stopped.
- Rules are defined as metric expressions such as
TotalTime.P90 > 500 ErrorRatecan be filtered witherrorStatusCodes- The same rule system works with client-side and server-side timing metrics
📊 Live metrics and anomaly detection
The built-in dashboard exposes both windowed and cumulative views. Windowed metrics show what happened in the latest interval, which helps surface short-lived regressions. Cumulative metrics show whole-run behavior for summary analysis and reporting.
- Use windowed views to catch spikes that whole-run averages can hide
- Use cumulative views for end-of-test summaries and SLA checks
- The REST API remains available even if the built-in dashboard is disabled
🧪 Client-side and server-side timing
LPS records client-side timings such as TotalTime, TTFB, TCPHandshake, TLSHandshake, SendingTime, and ReceivingTime. It can also parse server timing headers to expose ServerTime, ServerTimeDB, ServerTimeCache, and ServerTimeApp.
- Client metrics explain network and protocol overhead
- Server metrics help separate backend time from transport time
- Both can be used in failure rules, termination rules, dashboard panels, and exported metrics
🗄️ InfluxDB and external analysis
LPS has native InfluxDB integration. Metrics can be exported directly for retention, Grafana dashboards, and custom queries without building a separate exporter.
- Exports include cumulative and windowed durations, requests, response codes, and data transfer
- Final iteration status is exported when execution completes
- Configuration is available from the CLI via
lps influxdb ...
How the pieces work together
| Component | What it controls | Why it matters |
|---|---|---|
| Clients | User concurrency and arrival timing | Makes traffic feel closer to real user entry patterns |
| Rounds | Test phases | Keeps multi-stage scenarios readable and maintainable |
| Iterations | Endpoint behavior | Lets you model different actions inside the same test |
| Iteration Modes | Traffic shape | Lets you express bursts, durations, and request counts clearly |
| Termination Rules | Stop conditions | Allows the test to react to live health signals |
What this unlocks
With these pieces combined, LPS can model scenarios such as:
- Sudden spikes after a release, promotion, or webhook storm
- Recurring burst patterns that mimic polling, scheduled jobs, or batched events
- Staged ramp-ups that start small and progressively increase pressure
- User-like flows where one action leads into the next
- Outcome-aware runs that stop when the system is clearly under stress
That is the real value of LPS: it helps you describe how traffic behaves, not just how many requests to send.
From quick command-line experiments to richer YAML-based scenarios, the model stays consistent and easy to reason about.
Ready to go deeper?
👉 Explore The LPS Documentation on Github